


Tip of the Day | August 2, 2026
Discover new tools to get things done.
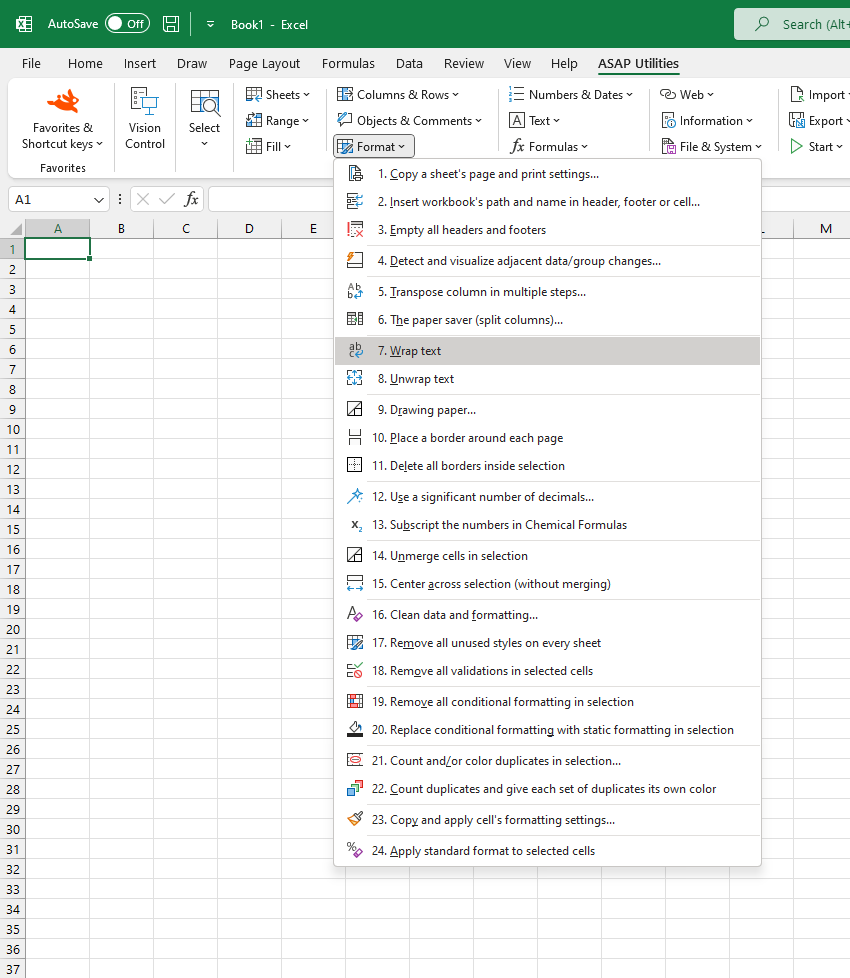
Wrap Text in Selected Cells
This tool enables text wrapping in the selected cells, allowing long content or manual line breaks to be displayed on multiple lines within each cell so that you can see all of it.
This is useful when:
- Making long text entries easier to read
- Improving the layout for printing or exporting
- Displaying multi-line data without resizing columns
Unlike Excel's built-in Wrap Text button, which toggles wrapping based on the active cell in your selection, this tool always enables wrapping regardless of which cell is active. This makes it more predictable and saves time, especially when working with mixed-format selections.
Another benefit of having this tool in ASAP Utilities is that you can assign a shortcut to it via 'My Tools & Shortcut Keys' for accessibility and even faster access.
Historical Note:
ASAP Utilities introduced this in 1999, years before Excel added a "Wrap Text" button to the ribbon in Excel 2007. Until then, it could only be set via the cell's formatting properties (Format > Format Cells > Alignment > Wrap Text).
Starting this tool
Specify a Keyboard Shortcut: ASAP Utilities › My Tools & Shortcuts › Manage My Tools & Shortcuts...
Tip:Alt+P for the previous tool.
Tip: Alt+N for the next tool.